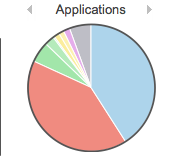
Oh, yeah! Pie charts, baby!
While I still haven’t gotten many chances to really put it through its paces, I really love a lot of aspects of the MR12 Meraki sent me. One of my favorite features is the ability to get a lot of granular detail on the network traffic clients are getting through the AP. There are places where raw data is fine, but a lot of the time, I want a nice visual representation just so I can get a quick idea of what I’m working with. This is especially true when we have weird hiccups or slowdowns on our network in certain areas. Unfortunately, I don’t have Meraki APs everywhere, so I can’t just pull up a lot of sexy data and quickly figure out what’s up. I’d really love to be able to do that, though.
So what does a sysadmin do when there’s a need but not a solution he knows? Google, duh.
And what does google give me? It gives me ntop. If you are a knowledgeable user and not just a luser, you have probably used top before to find out what processes are using the most of your memory and processor at any given time. Well, ntop is something like that, only for networks. But, more than that, it can give you nice graphical representations of your data through a web interface.
Having just run across ntop this very hour, I haven’t dived into the man pages for it yet, but I have written a long command chain so that I can read the things without standing in front of my Linux terminal, and, because sometimes I just want to write a long command, here’s what I did:
man -t ntop > ntop_man.ps && ps2pdf ntop_man.ps && rm ntop_man.ps && scp -P 22 ~/ntop_man.pdf [user]@[lappy]:/Users/[me]/Documents
So there.
(Of course you can expect me to post more about ntop as I dive in and find out what it can do for me and, by extension, what it might be able to do for you.)


